Flu v Covid 19
There are still cranks out there who will insist that the current pandemic is nowt to be concerned about. It’s just ‘a bit of flu’. Conspiracy theorists, presidents and even a pair of Californian doctors have jumped on this bandwagon.
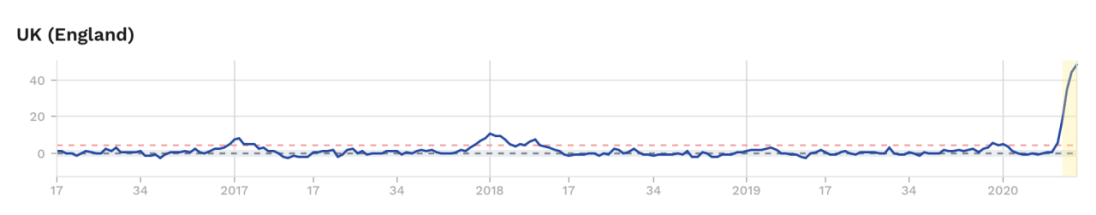
The graph above shows a standardised mortality rate for the UK over the last four years (source). You can spot the little peaks at the end of/beginning of each year that account for seasonal flu. You might, if you are sharp eyed, notice a bit on an increase at the end of the graph.
The graph is for all deaths. Cancer, road accidents, flu, heart attacks, strokes, falling down stairs, getting hit by lightning, nut allergies and falling coconuts. It’s not for me to tell you why there might be such a massive rise starting in March 2020. You can come to your own conclusions. But if you struggle to believe it has anything to do with Covid-19, then perhaps you might want to reconsider whatever methodology you were using.
But hopefully, you’re a sensible person. One who steers clear of whacky conspiracy theories. One who pays no attention to wannabe fuhrers. You’ve noticed that the hospitals have been struggling, that new hospitals have needed to be built quick sharpish. And I think we’ve gotten to the stage where an awful lot of people know someone who has been hospitalised. Or worse.
We don’t know how many already sick people would have died in the next few weeks anyway. There are claims that people are being recorded as having died of Covid-19, but may have died of their underlying health issue. Maybe that’s the case. We could argue about the precise numbers all night. But. Look at the graph.
A lot of people are dying. Far, far more than is usually the case. Ponder this as well. That graph represents a country – England – which responded to the threat far too late, and far too weakly. But that did eventually institute a lockdown once the disease had taken hold. So that graph also represents a country which took drastic, far reaching action.
Can you picture how that graph might look had a decision been made to carry on as normal? We’d be losing 10,000 a day now. Our health system would already have collapsed. And a half million dead at the end of it would be looking like a ‘good outcome’. As things stand, we might get away with just 60k to 80k Covid-19 related deaths. Might…
Thanks to a lockdown, we might get away with a mortality figure that’s just 200% to 300% higher than the last two major flu outbreaks. A figure that’s twice as bad as the Asian flu of ‘58. As bad as the Hong Kong flu of ‘68. Half as bad as the Spanish flu*. We might get away with this. With the lockdown. Thanks to the lockdown. That’s worth pondering, isn’t it?
*The reasonable estimate of number of UK deaths without any restrictions was 500,000+. There were 200,000 deaths from Spanish flu in the UK.
